Creating Inclusive Cartographies with OpenStreetMap
Timothy Monteath 
Carlos Cámara-Menoyo
Welcome!
Thank you for taking part in our workshop! Before we being there are a few house keeping items. Your participation is entirely voluntary, and we are deeply grateful for your invaluable help, you are free to leave at any time, ask us questions or change mind about taking part in our research. Please read the Participant Information Leaflet, where you will find key information about who we are, what we do, what we’d like to ask you and what your rights are so you can make an informed decision.
Overview of the Workshop
This is a rough outline of what we will be covering in this workshop and the timings we will try and stick to!
- 12:00 - 12:20: Welcome, context and briefs
- 12:20 - 12:35: Maps and inequalities (Mirela Reljan-Delaney)
- 12:35 - 13:25: Tools: OpenStreetMap and QGIS
- 13:25 - 14:50: Lunch
- 14:50 - 15:05: Group Formation
- 15:05 - 16:25: Producing a cartographic style
- 16:25 - 17:00: Discussion and evaluation.
Introducing QGIS

QGIS is software for making maps and working with spatial data. It is free and open source software that is actively maintained and developed by the QGIS Foundation and is part of the OSGeo Foundation and is avalable for all operating systems. You can accomplish almost any GIS (Geographic Information Systems) or mapping task you can think off. Indeed, QGIS has an incredible range of functionality and complexity built in, which we will only be scratching the surface of today.
If you haven’t download QGIS already, you can get it here: Download
When you open up QGIS you it will look something like this:

There are 5 main UX elements:
- Data Browser - Contains file directory, bookmarks, and a list of pre-defined data sources.
- Layers - When adding data, of any sort, it will create a layer. Layers are ordered, like in graphic editors like Photoshop or Inkscape.
- Map render - Our data will display here and can be interacted with.
- Toolbar - The number of icons in QGIS can be overwhelming! For today we are only going to use a small selection of these buttons.
- Menu Bar - A huge wealth of tools and options are also hidden in QGIS’s menu’s.
Because of all the many, many, tools and options in QGIS written textbook style descriptions can be hard to follow. To get us making maps quickly for this workshop, we are going to be combing a live demonstration with short video’s and how-to’s on this page covering the same information. What we are covering today is only one way to accomplish these tasks. There are many other ways in which we could be making these maps, importing and working with data in QGIS, and the focus of today is to get mapping quickly rather than the most efficient, comprehensive or detailed way to produce such maps.
The toolbar has lots of icons but for today’s purpose we are only going to be using a small subset of them:

- Navigation Buttons - buttons to control panning and zooming.
- QuickOSM Plugin Button - which we will be installing in the section below.
- OSMInfo Button - also to be installed.
Plugins
While QGIS, by default, has lots of tools and features, what it can do is also vastly expanded (or made easier) through plugins. Installing plugins is easy and can be done through the Plugins > Manage & Install Plugins option in the menu bar as shown in this video.
For today’s workshop we are going to be relying on:
HCMGIS - adds a number of utilities for adding in basemaps (especially vector basemaps), downloading open data as well as other spatial processing tools.
OSMInfo - Extracts feature infomation from OSM for anything under a point you select.
QuickOSM - A plugin for downloading OSM data from the Overpass API directly within QGIS.
They should all be available to install from the QGIS plugin repository from within QGIS.
Basemaps
The easiest way to get mapping quickly in QGIS is to simply load in a raster map, much the same way you would open up a web map in your browser. By default, QGIS includes OSM as one of the options for this. It can be found within the Data Browser Panel > XYZ Tiles > OpenStreetMap.
Double clicking on this item will load in the default OSM map as its own layer. You can zoom in and out, seeing the same tiles you would at https://www.openstreetmap.org/.
This is the quickest way to orient yourself with QGIS and move to a location you are interested in mapping. If I were teaching a course on QGIS, this is probably something I would save for a few weeks in. Instead I would probably start with shapefiles, csv data and choropleth maps, which are a good way to learn the basics of GIS data. But, for today we are OSM focused and this is the fastest way of starting orientating yourself and importing OSM data.
OSM Features and Layers
With the OSM baselayer loaded lets navigate to an area that we want to try and map.
For the purpose of this workshop you probably want to find a small/medium sized area depending on how built up it is. For my demonstrations, I have picked the University of Warwick. The balance here is that an area that is too big will mean that the API request we make later might time out, or computer dependent, that to many data points and layers may start to make things lag. Too small, however, and there might not be enough features for us to make a map with.
To query the size of areas and quickly pull out the polygon of the area we can use the OSMInfo Tool.
By clicking on an area of the map, OSMInfo passes the long/lat of that location to the Overpass API and extracts all OSM features under or nearby to that point. The details of which are then loaded into a sidebar which can then be explored in more depth.
To load in our area of interest - in this case the University of Warwick - we can look at the Is inside tab, then left click > Save feature in new temporary layer. This will add the feature as a polygon, but note that it will not be saved to your computer or QGIS save file unless you save it as a specific file. We will do this at the end of the workshop, so that you can share your work. But if you are worried about losing layers, or your crashes before this, temporary layers can be saved to file by left clicking on the temporary layer and going Export > Save Feature as….
With a layer of our data now imported into QGIS, we can start to adjust how we want this feature to be represented. To open up these options we need to select the layer left click > Properties. This will open up a new window with a large range of options for how the layer is styled. We want the Symbology option.

Most of the styling we will want to work with today will be under this tab. As a neat shortcut we an use the Inverted Polygon option which will fill the whole map outside of our selected area with this color. This both makes it easeir to focus on the area we are choosing to map today and makes our final output look neater and more focused when we disable to default OSM layer.
Querying OSM data
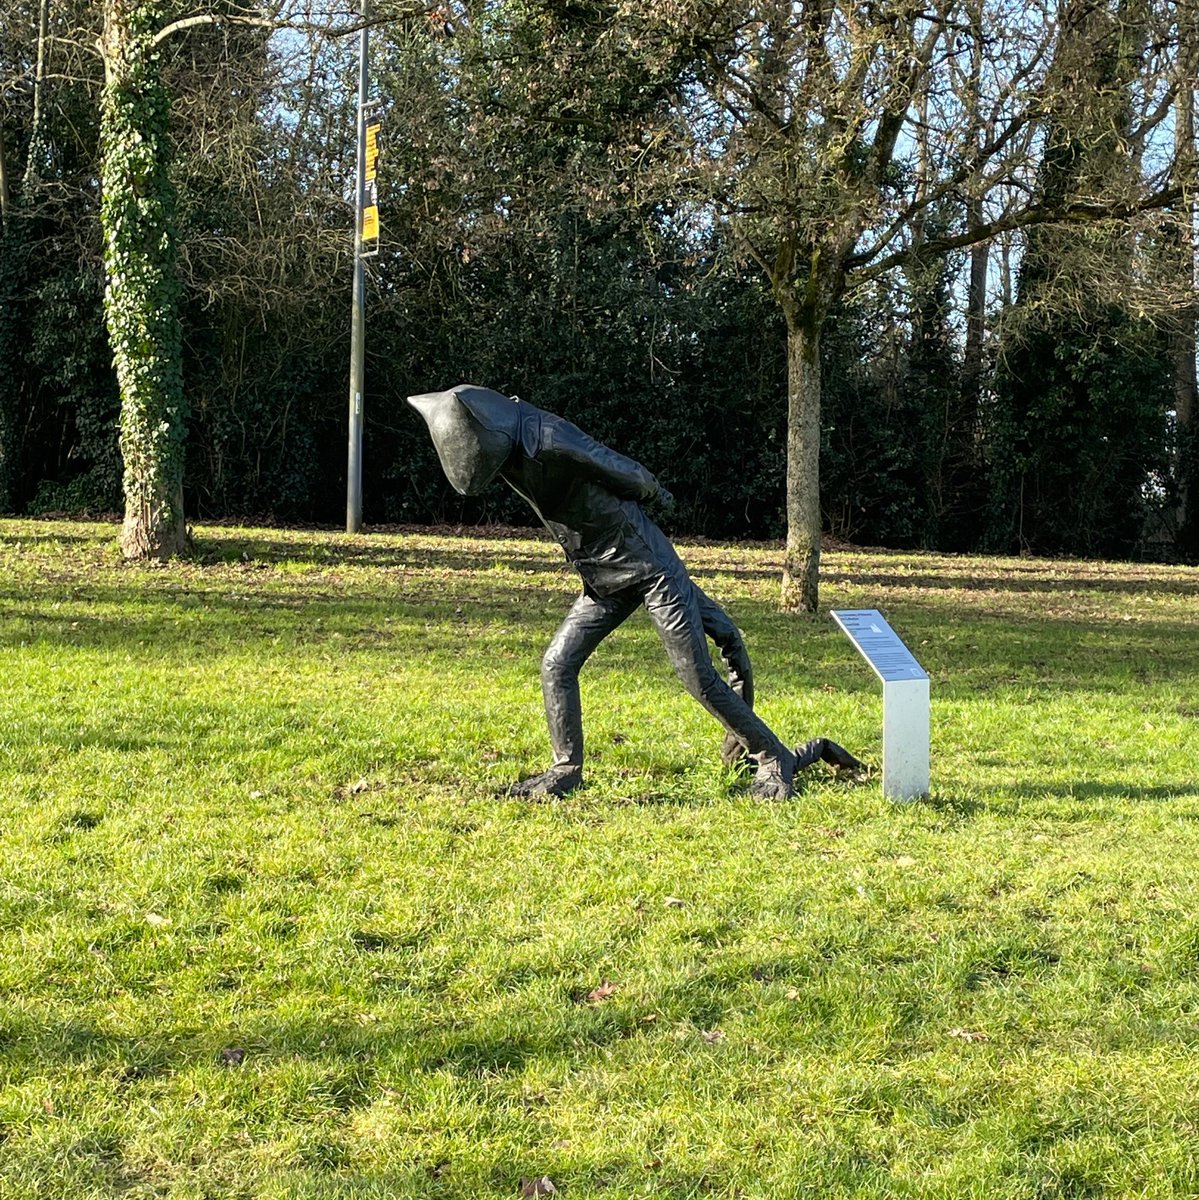
Using the OSMInfo tool we can also pull a larger range of data, by using the tool to look up Key/Value pairs which are the basis of all all OSM data. As an easy example I am going to look up sculptures at the University of Warwick. In the video, I click on a point where I know a sculpture is located called Day of Judgment - Cat 1. From the info this returns I can see that key/value pair we need is of tourism:artwork.
This information can then be entered into the QuickOSM plugin under the Quick query tab. We specify the ‘Key’ as ‘tourism’ and the ’ ‘Value’ as artwork, then we set ‘In’ area as University of Warwick, if we do not delimit the area in some way the API query will fail. Once everything is set, click on Run Query for the data to be pulled from Overpass.
The style of the loaded points can then be customized. The menu to do this is the same as for polygons, by selecting our layer and left click > Properties. The symbology options for how this is rendered, however, will be slightly different. We can pick simple shape markers and customize their color, size and shape.
We can also use custom icons to depecit our points. By default their are QGIS icons that we can select from, or we can use our own SVG’s.
There are lots of Open Source icon sets that we can draw on for our cartography - ranging from Health Icons to ‘Modern’ styles.
Routes and Ways
OSMInfo can also be used to find out information of routes and ways. Depending on what we are querying this may return lines, points or polygons. Following the University of Warwick example, I am going to request all bus routes in and out of the University. Clicking on a bus stand with OSMInfo returns all the routes that use this stop. From this we can also see that the key/value pair is route:bus, which we can then query from overpass using QuickOSM.
On thing to be aware of is that when querying data types like this overpass will return all matching data of the key/value pair that intersects with our area of interest. In this case we have route and stop information for the extend of all bus routes that pass through or stop at the University of Warwick. Beware that depending on the type of object you are looking at this could be a significant amount of data.
Raster and Vector Maps
So far we have been adding features on-top of the OSM basemap, to either start creating our own map from scratch or to add extra layers that build on what OSM already does. Until recently editing the OSM basemap would have been an onerous task. The OSM basemap we loaded using the XYZ tiles in QGIS are Raster tiles, which means that what we see as the ‘map’ is actually lots of pre-rendered images that our browser or other software stitches together. If we wanted to tweak or add one element to these tiles we would need to render them all again. Recently, in 2024 OSM began hosting vector tilesets in which the ‘map’ data is not rendered but passed as vector data which is ‘drawn’ client side. If we zoom in on the map in great detail we can see how the difference between the two in action:


For our purposes this also means that we can start to customize the actual OSM basemap itself.
To do this we first need to load in the same data from a vector source. The easiest way to do this is by using the HCMGIS plugin. (Other plugins also have this functionality, and vector maps can also be added by url but this is by far the easiest way for now).
From the HCMGIS menu bar we can select HCMGIS > Basemaps > Vector Tiles > ESRI OSM Standard for a comparable map.
Selecting the Layer > Properties vector layers like this can be edited directly within QGIS. The symbology options for vector sets looks different again, but functions much the same if we think of each label as its own layer that can be styled in the same way as any other layer.
What this also reveals is the huge range of symbology and styling rules needed for a modern web map - with different settings needed for different zoom levels. Trying to customize everything here would weeks of work! I would suggest, in the interests of speed, cutting what you don’t want, such as labels or specific symbol types (which can be searched for) and adding in what you want through seperate layers.
Useful keys and values
To get started here are are few sets of keys and values that you might find useful.
| Description | key | value | notes/OSM wiki |
|---|---|---|---|
| Amenities | amenity |
See https://wiki.openstreetmap.org/wiki/Key:amenity for a list of possible values | |
| Bench | amenity |
bench |
https://wiki.openstreetmap.org/wiki/Tag:amenity%3Dbench |
| Bicycle parking | bicycle_parking |
See https://wiki.openstreetmap.org/wiki/Key:bicycle_parking | |
| Bike shops/repairs | shop |
bycicle |
See https://wiki.openstreetmap.org/wiki/Tag:shop%3Dbicycle |
| Buildings | building |
See https://wiki.openstreetmap.org/wiki/Key:building for a list of possible values | |
| Bus stop | highway |
bus_stop |
See https://wiki.openstreetmap.org/wiki/Tag:highway%3Dbus_stop |
| Cycle lane | cycleway |
See https://wiki.openstreetmap.org/wiki/Key:cycleway | |
| Charity | office |
charity |
See: https://wiki.openstreetmap.org/wiki/Tag:office=charity |
| Drinking water | amenity |
drinking_water |
https://wiki.openstreetmap.org/wiki/Tag:amenity%3Ddrinking_water |
| Foraging | foraging |
See https://wiki.openstreetmap.org/wiki/Key:foraging | |
| Free entry to places | fee |
no |
See https://wiki.openstreetmap.org/wiki/Key:fee |
| Green spaces | There are different keys to define green spaces according to their type. Refer to https://wiki.openstreetmap.org/wiki/Green_space for a list. | ||
| Groceries | shop |
convenience``butcher``department store deli supermarket… |
See https://wiki.openstreetmap.org/wiki/Key:shop for a list of possible values |
| Healthcare | see https://wiki.openstreetmap.org/wiki/Healthcare | ||
| LGTBIQ+ | lgbtq |
The lgbtq=* tag indicates the level of LGBTQ+-friendliness (lesbian, gay, bi/bisexual, trans/transgender, queer etc.) of a feature. REfer to https://wiki.openstreetmap.org/wiki/Key:lgbtq for a list of variations. |
|
| Museums | tourism |
museum |
See https://wiki.openstreetmap.org/wiki/Tag:tourism%3Dmuseum |
| Parkrun | network |
parkrun |
See https://www.openstreetmap.org/relation/12457099 for an example or https://overpass-turbo.eu/s/2ecx for a query |
| Playground | leisure |
playground park |
See https://wiki.openstreetmap.org/wiki/Tag:leisure%3Dplayground |
| Roads, paths, cycleways… | highway |
See https://wiki.openstreetmap.org/wiki/Highways for detailed explanation and list of potential values. | |
| School | amenity |
school kindergarten college university |
See https://wiki.openstreetmap.org/wiki/Tag:amenity%3Dschool and a list of possible education establishments https://wiki.openstreetmap.org/wiki/Education_features |
| Shelter | amenity |
shelter |
https://wiki.openstreetmap.org/wiki/Tag:amenity%3Dshelter |
| Street lamp | highway |
street_lamp |
This is used for street lamps with a known position (points): https://wiki.openstreetmap.org/wiki/Tag:highway%3Dstreet_lamp |
| Street lighting | lit |
This is to describe if a feature (a street, park…) is lit or not, or if it’s lit on a certain period of time: https://wiki.openstreetmap.org/wiki/Key:lit | |
| Toilets | amenity |
toilets |
See https://wiki.openstreetmap.org/wiki/Tag:amenity%3Dtoilets for more info (i.e. about accessibility, access…) |
| Timetables / Opening hours | opening_hours |
https://wiki.openstreetmap.org/wiki/Key:opening_hours |
Finding OSM Data
OSMInfo can be a great way to start finding data based off locations you already know, but there are many other ways of finding data of interest.
Wiki
The OpenStreetMap wiki has a wealth of information, and like Wikipedia itself, you can find out a lot simply by browsing and following links.

Tag info
Is a site that visualizes the popularity of keys and values. It can be particular useful for exploring the relation between tags and information that you might not think to look for!

Maputnik
Maputnik is an Open Source tool for customizing vector maps from your web browser. One feature it has, of a data source explorer can also be useful for exploring what data is available for locations that you know. While this feature still only renders some of the data in the OSM database it can be another useful way to explore data.
In early iterations of our workshops we tried to create cartographic maps using Maputnik - but we found that it was often limited. If you are interested in the slides - or if you haven’t been able to install QGIS today - you can look at them here:
Saving and Exporting
To export both the styles and data we can use the geopackage format. This format isn’t listed under any of the normal save options in QGIS which treats QGIS save files and data separately. Which means if you only send QGIS Project file it will point to the file paths for your local computer.
To save as a geopackage we can find the command we need in the Processing Toolbox where many of the more complex formatting and processing options are hidden. Geopackages can be found by going through the menu bar Processing > Database > Package Layers.
However, this DOES NOT INCLUDE VECTOR LAYERS to export a vector layer you need to select the layer Export > Save as Layer Definition Layer … .
We would also really appreciate it if you could send us a screenshot of what you have made in QGIS so that we can double check that what we load up later matches what you have made!